Purpose
The Reports Screen serves as the analytic dashboard for the application. It aggregates data from Sales, Purchase, Customer, and Distributor providers to give a daily financial overview and historical trends.
Widgets
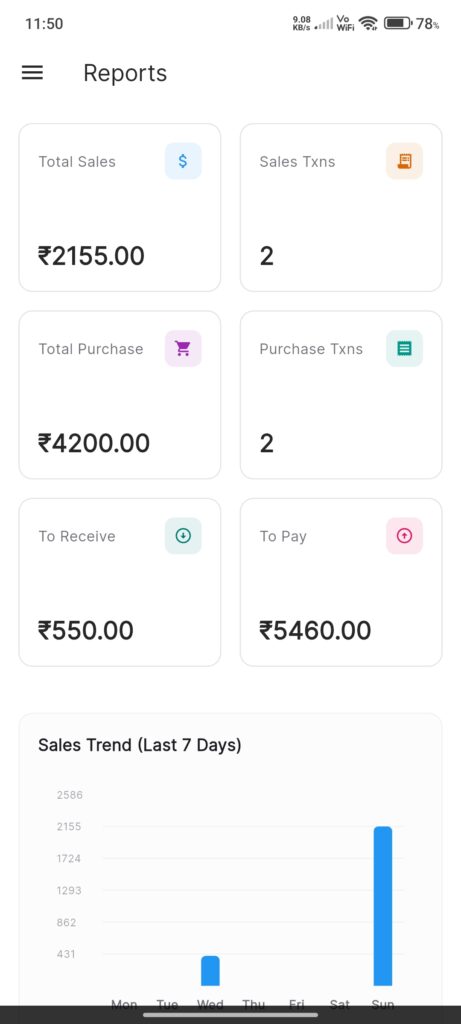
- KPI Grid: Display cards for key metrics (Today’s Data):
- Total Sales: Net sales (Revenue – Refunds).
- Sales Txns: Total count of sales and return transactions.
- Total Purchase: Total value of purchases made today.
- Purchase Txns: Total count of purchase and return transactions.
- To Receive: Total outstanding balance from all Customers.
- To Pay: Total outstanding balance owed to all Distributors.
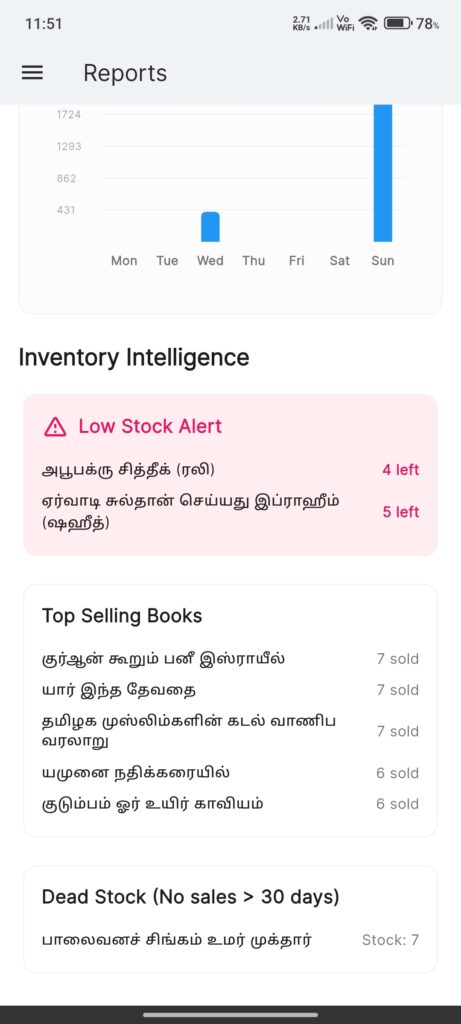
- Sales Trend Graph: A chart showing sales performance over the last 7 days.
Data Logic
- Date Filtering: Metrics are calculated based on the current system date (`DateTime.now()`).
- Net Sales: Calculated as `Total Revenue – Total Refunds`.
- Balances: Sum of all individual customer and distributor balances.
Interactions
- Refresh: Pull-to-refresh triggers a reload of all data providers.
- View Only: This screen is primarily for viewing data; no direct edits are performed here.